Nine dashboards.Zero report building.
Most CRMs hand you a report builder and wish you luck. Clone CRM ships three dashboards, three tabs each, built around the questions leaders actually ask. And every one of them works in chat too.
Every chart answers a question.
A one-line answer computed from your data, a table view, a click-through to the records, and a to-do list at the end of every tab.
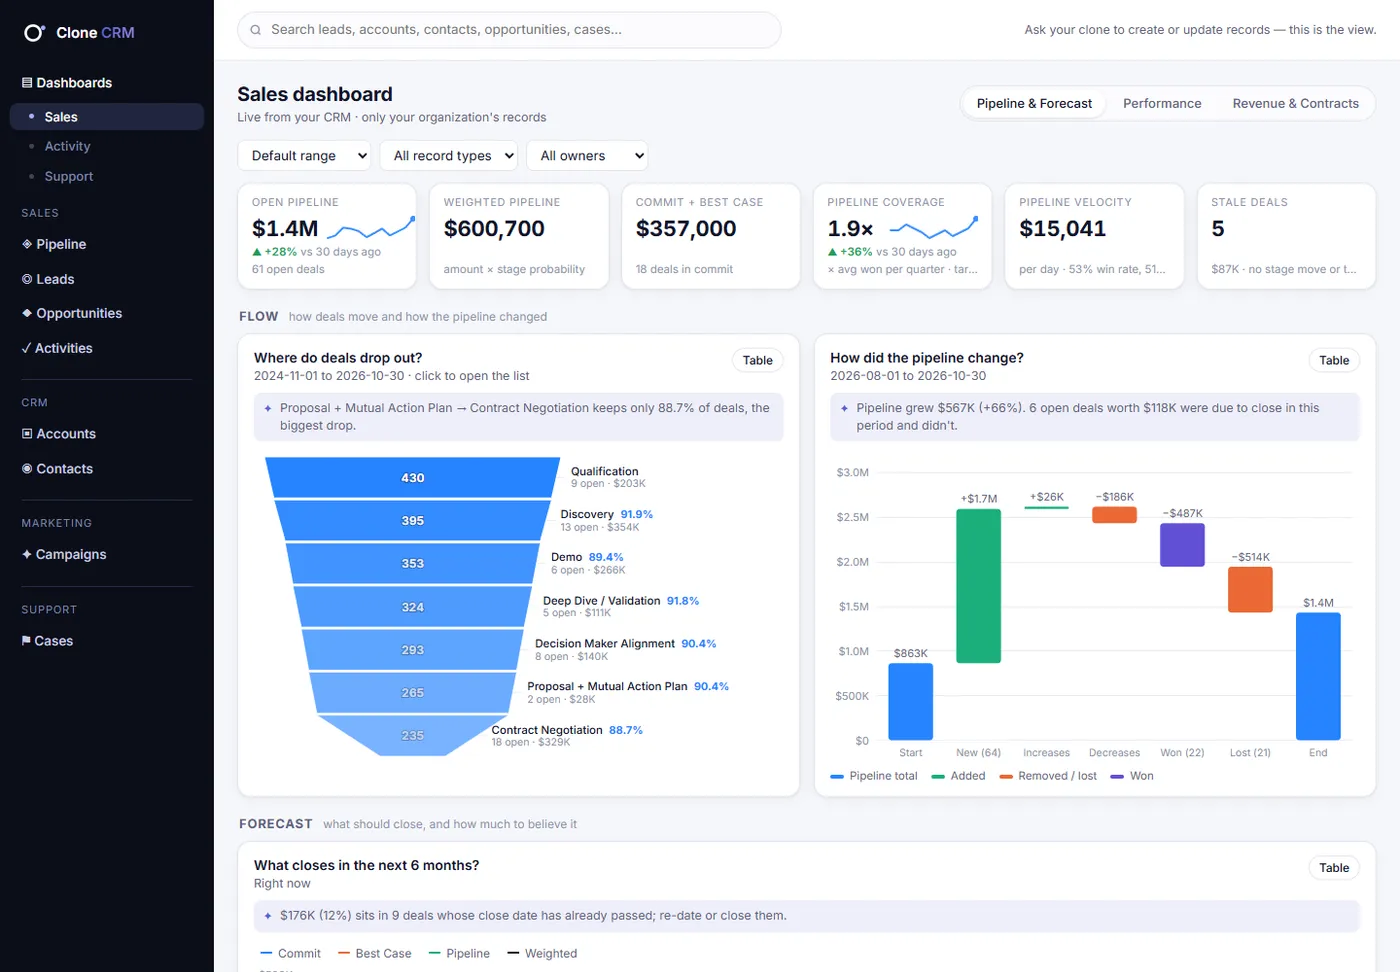
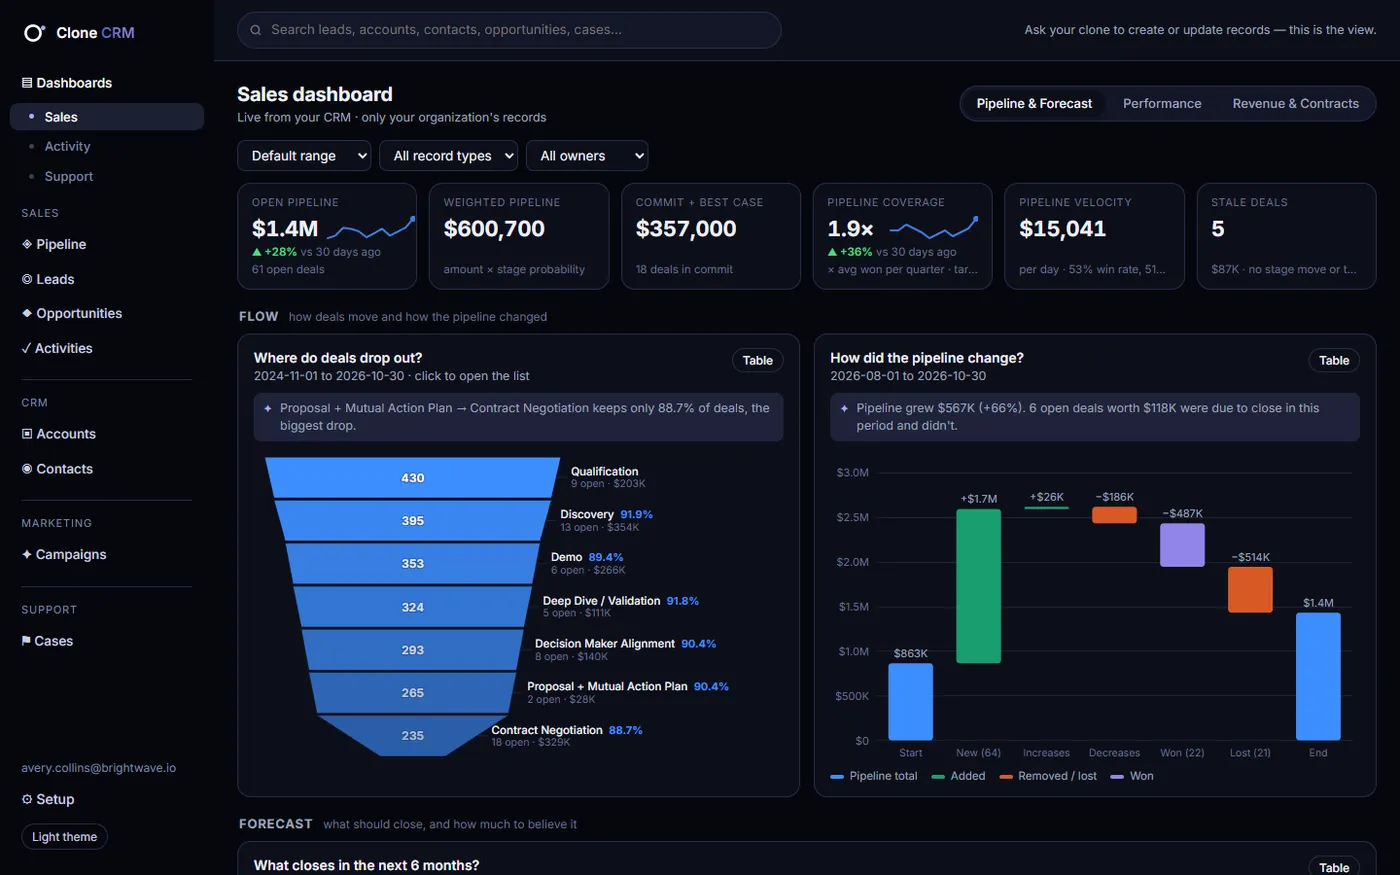
What will close, and can we believe it?
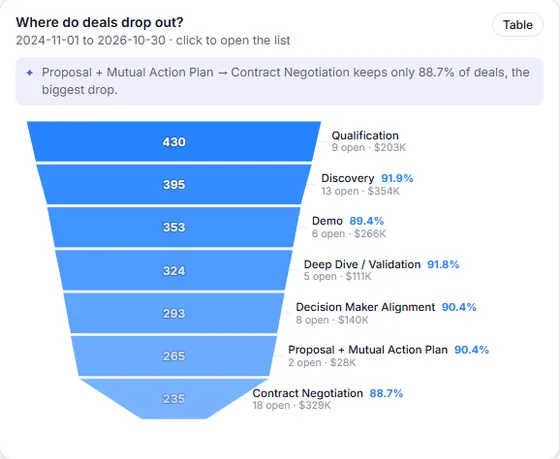
- Funnel with the biggest drop called out
- Pipeline waterfall
- 6-month forecast by category
- Big, stuck deals bubble chart
To-do list: At-risk deals, with the reason next to each
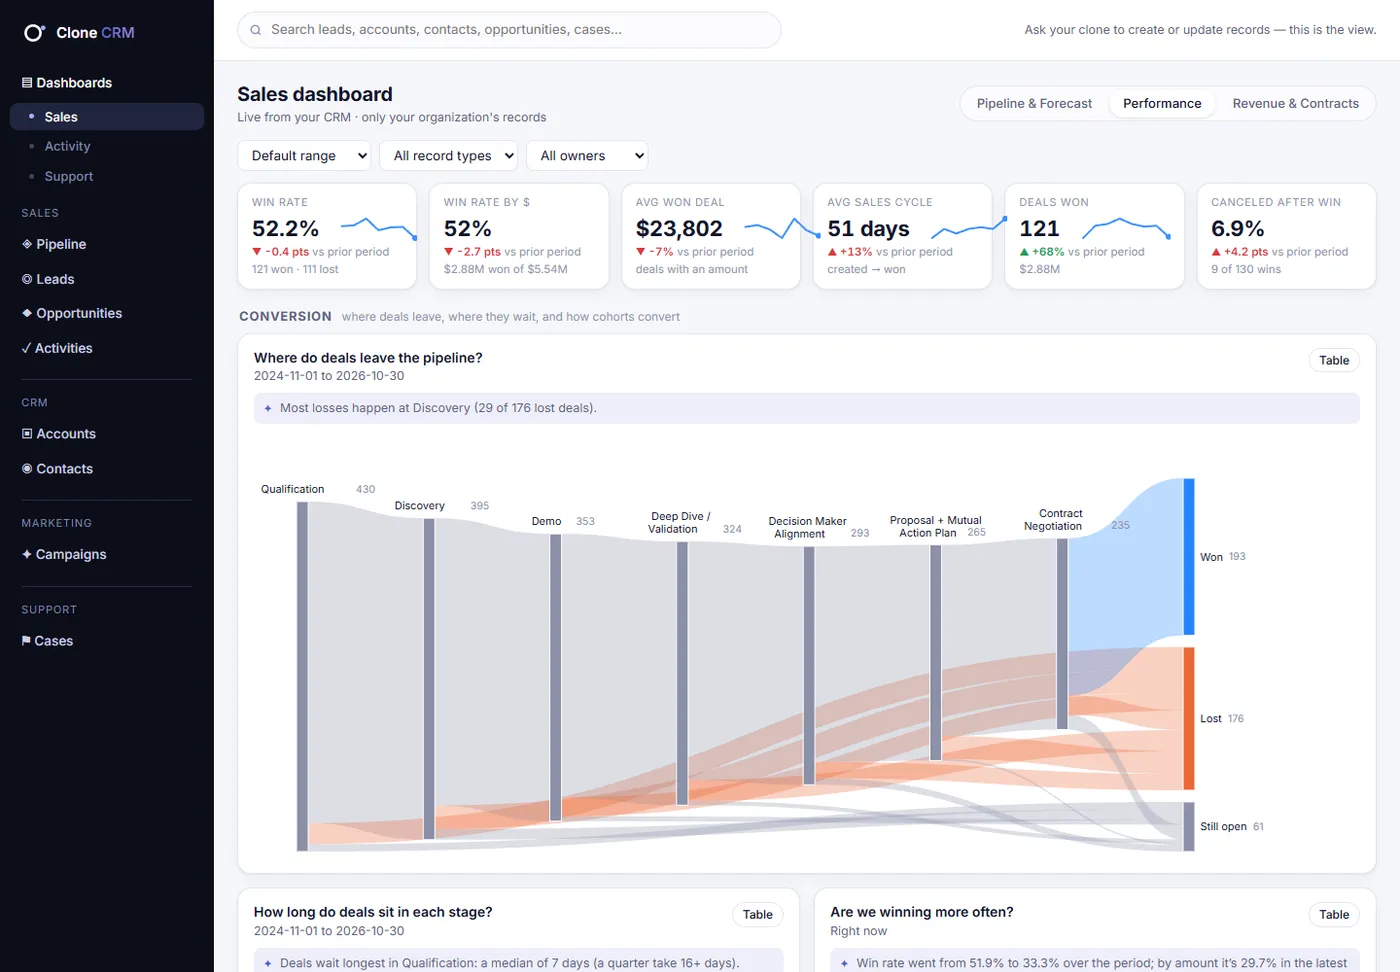
How well do we win, and why?
- Sankey of where deals leave
- Days per stage
- Quarterly cohorts
- Loss-reason Pareto
- Owner radar
To-do list: Deals closing soon without a plan
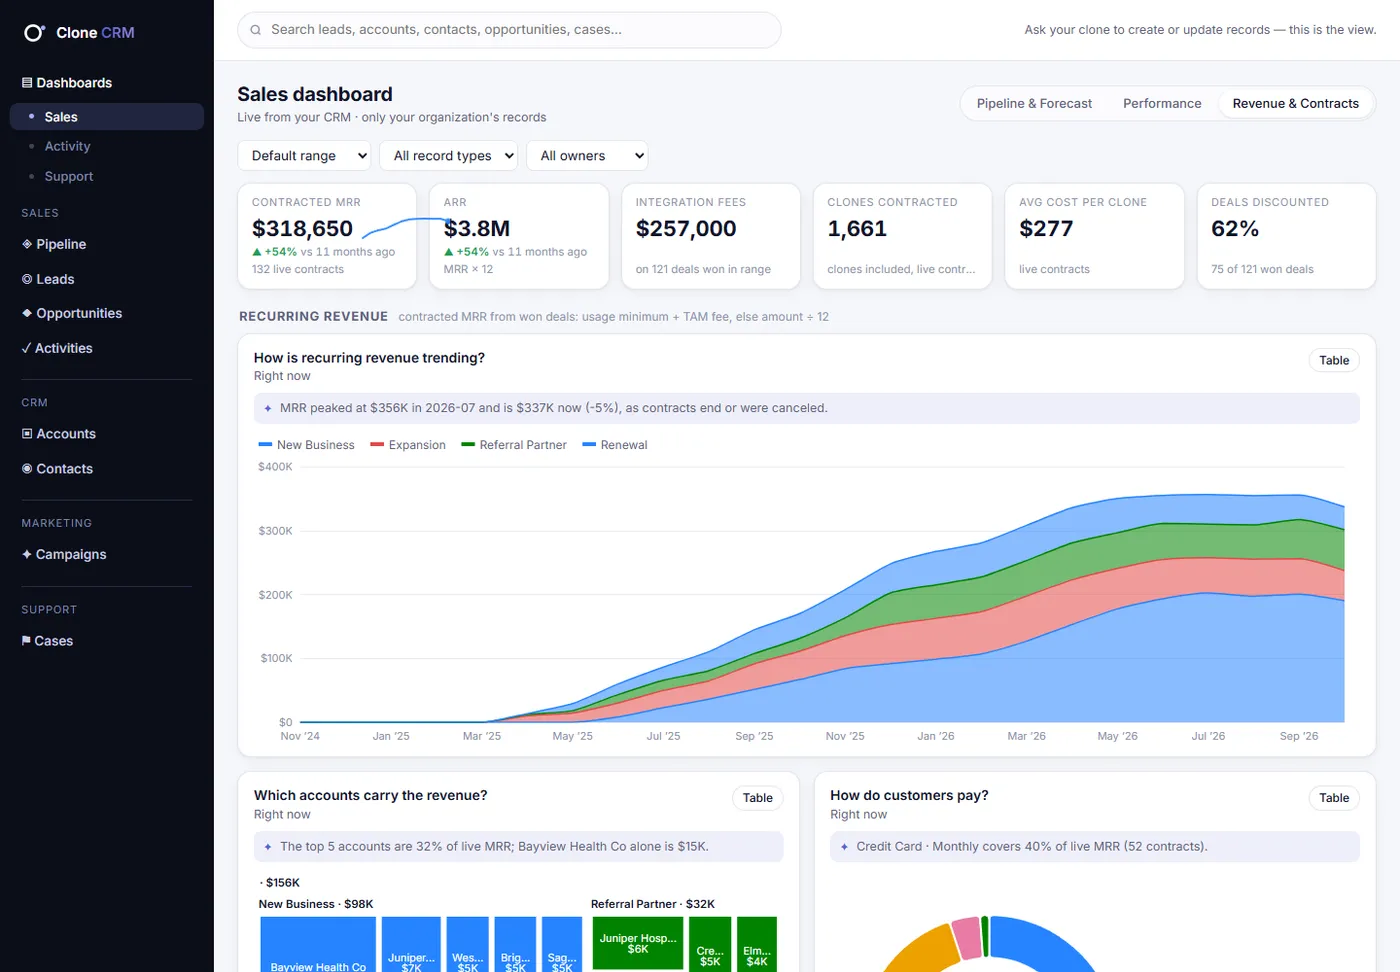
What are we earning, and what renews?
- Recurring revenue over time
- Revenue concentration treemap
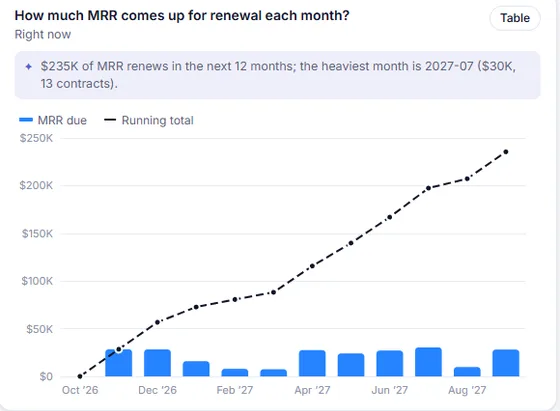
- 12-month renewal timeline
- Partner and referral revenue
To-do list: Contracts ending in 90 days, with last contact
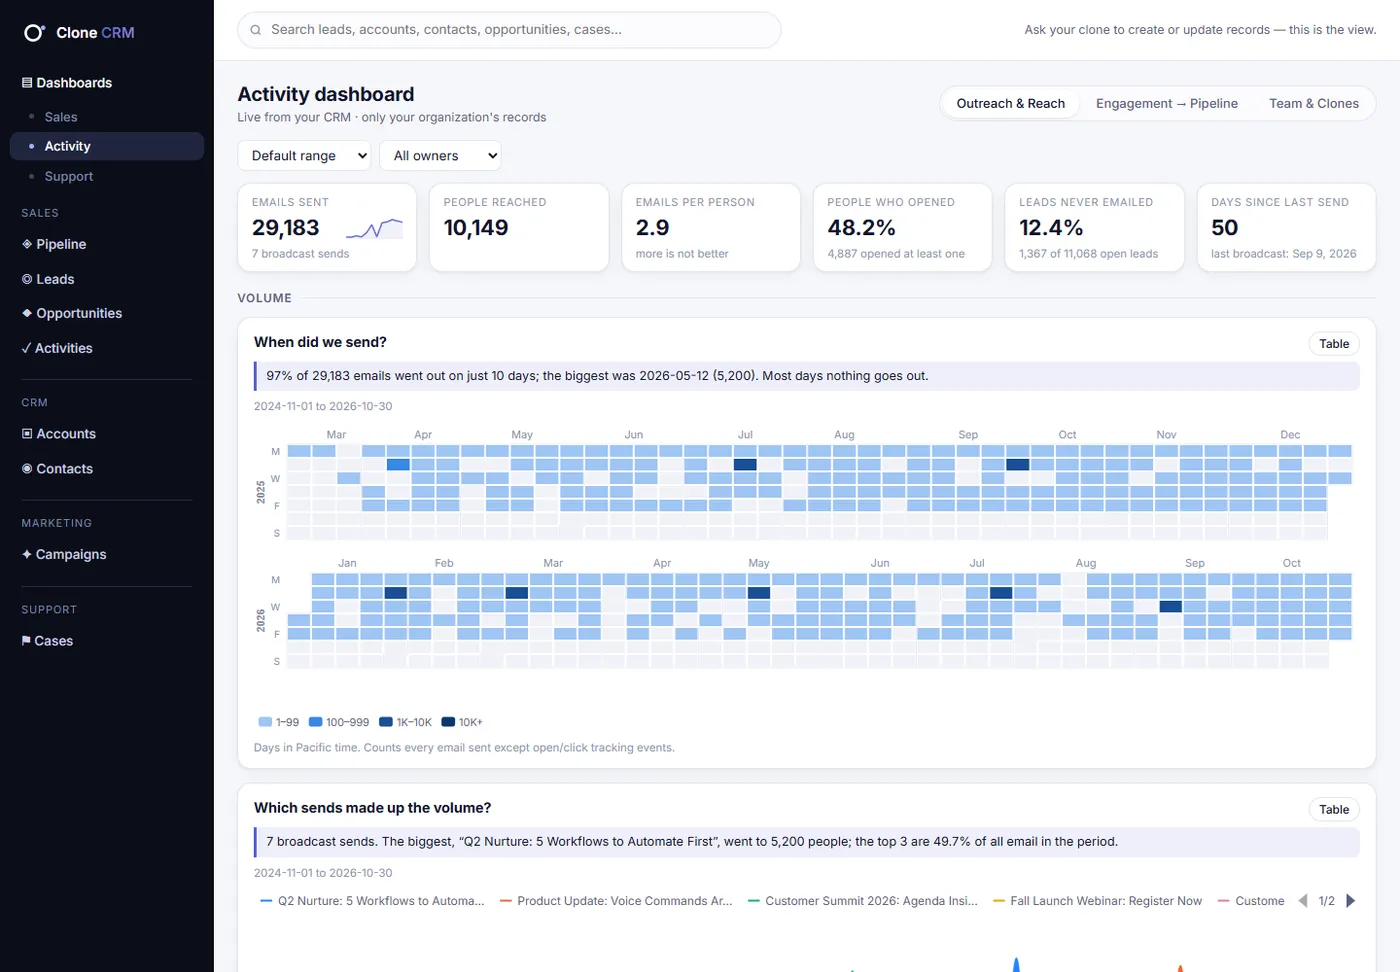
How much did we reach, and whom?
- Send calendar
- Opens per send
- Over-mailing check
- Reach by industry and state
To-do list: High-fit leads nobody has contacted
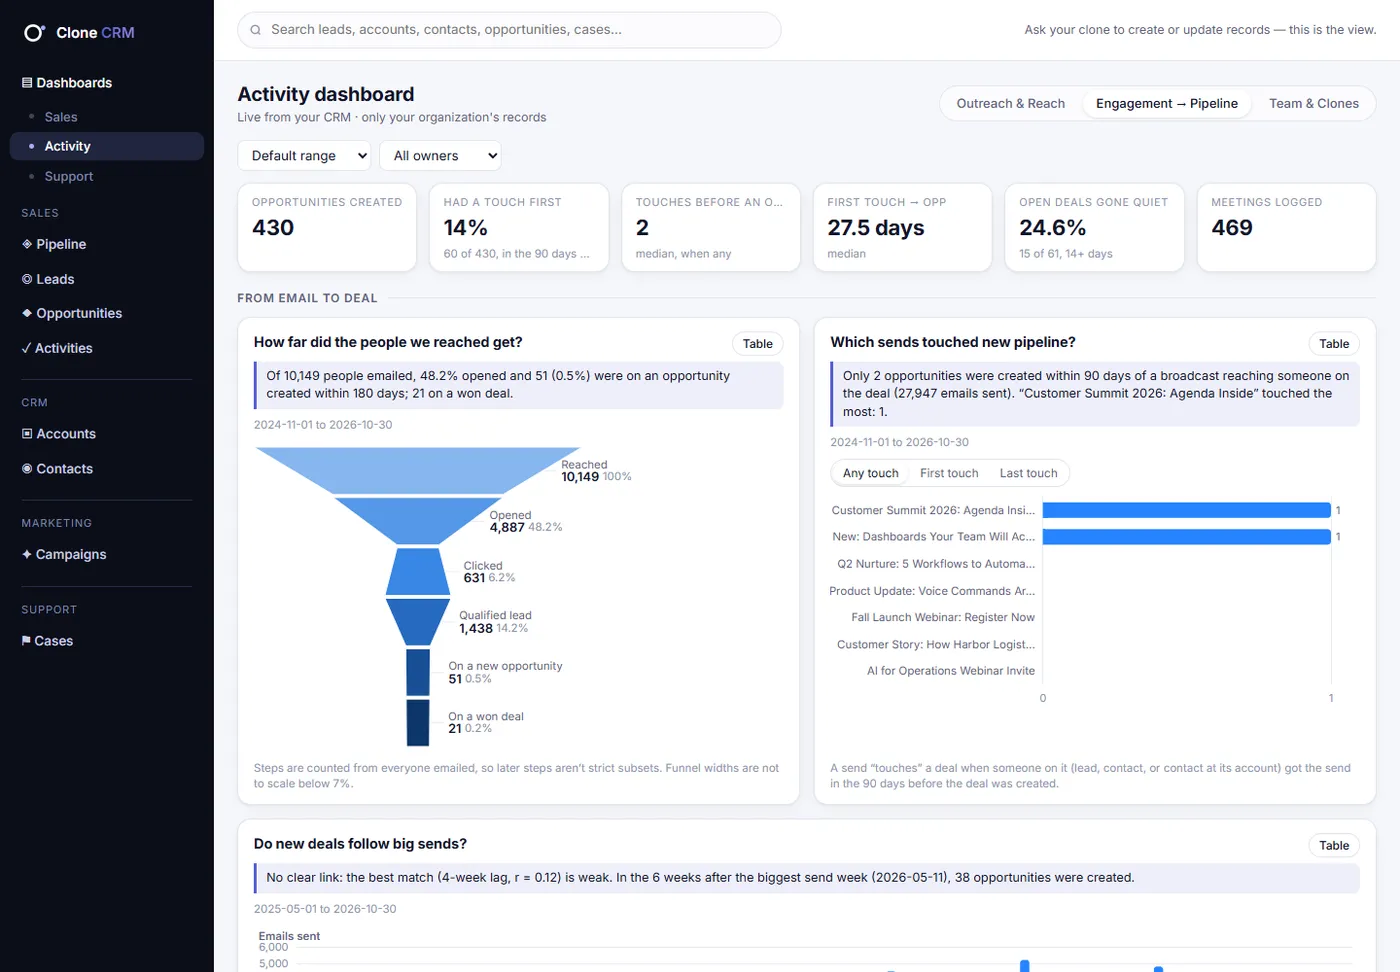
Did the outreach move anything?
- Reached → won funnel
- Send-level attribution
- Lag check
- Activity on winners vs losers
To-do list: Open deals going dark
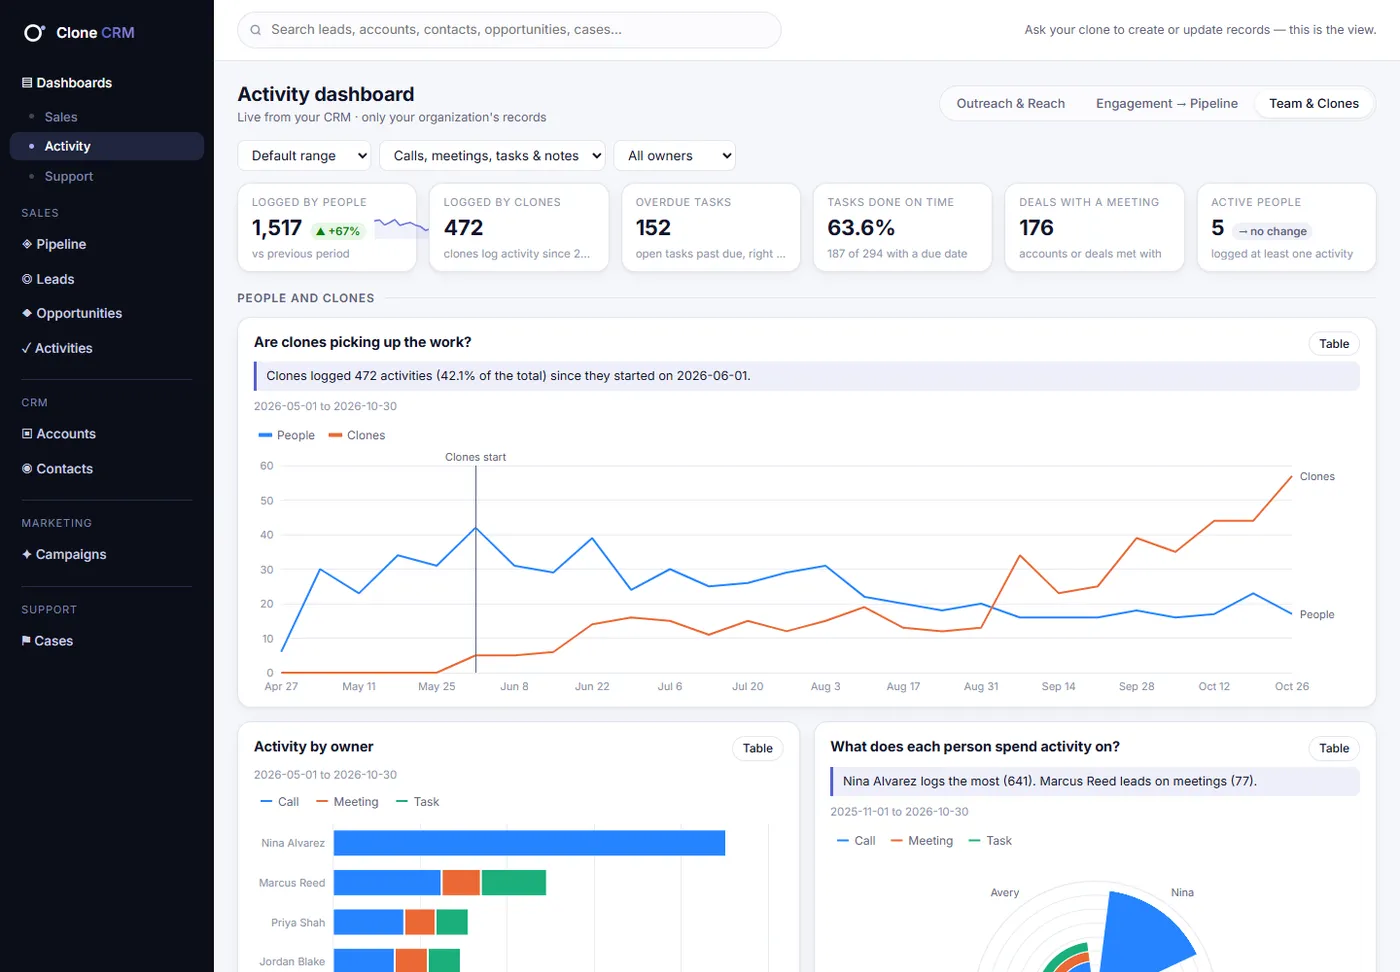
Who is doing the work: people or Clones?
- People vs Clones, week by week
- When the team works
- On-time task completion
- Owner scorecard
To-do list: Overdue tasks, with a nudge to your Clone
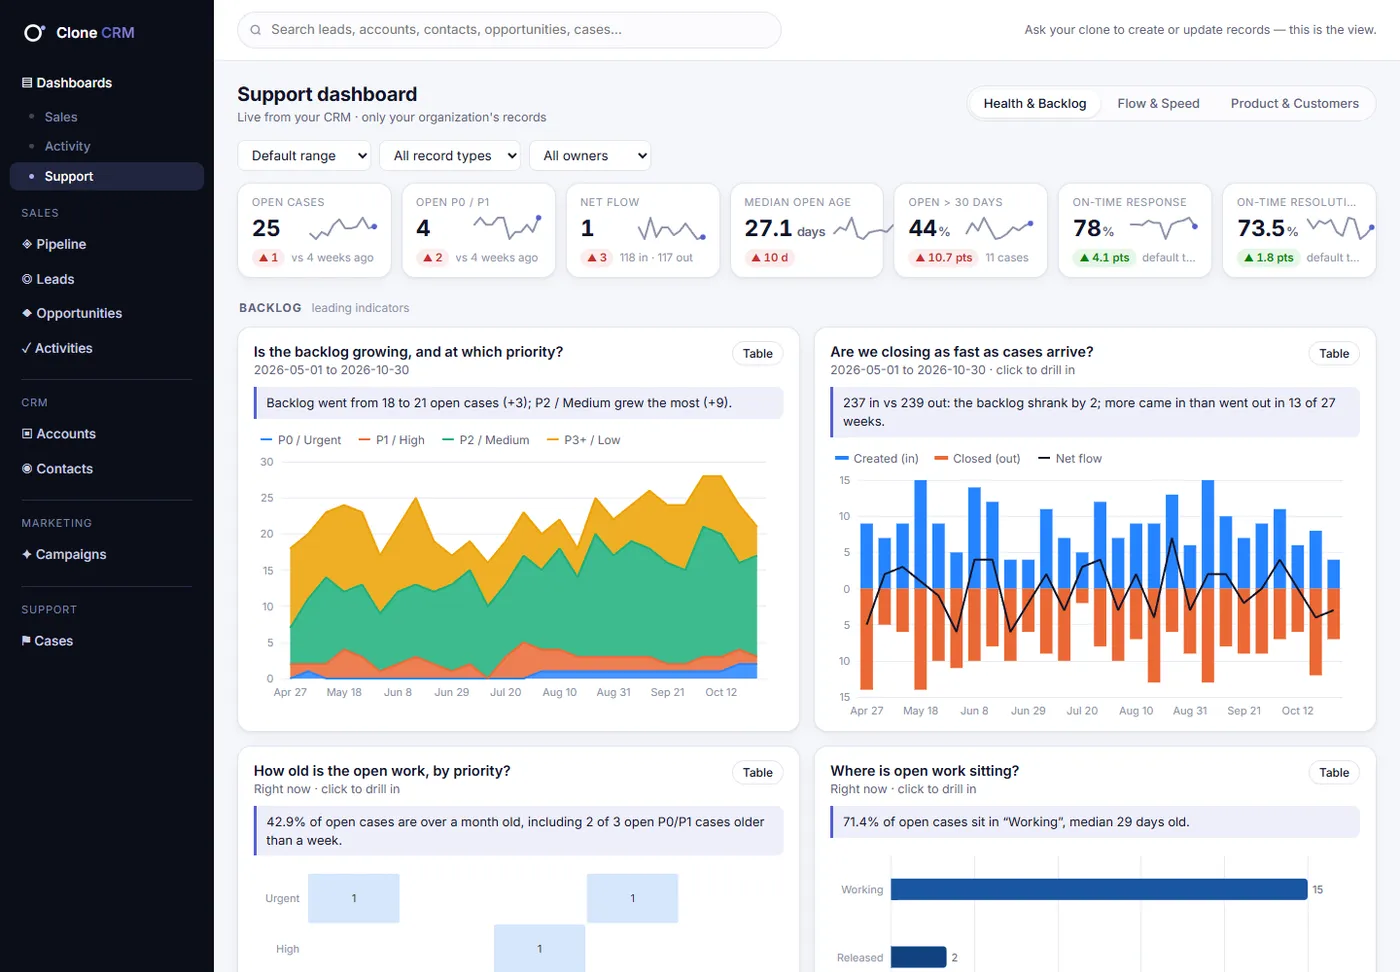
Are we keeping up?
- Backlog by priority
- Cases in vs out
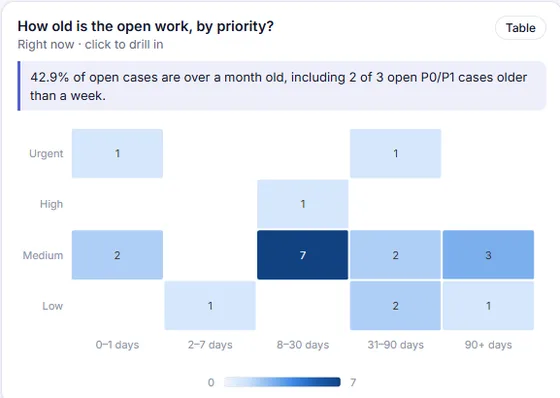
- Aging matrix
- Service-target gauges
To-do list: At-risk and probably-stale cases
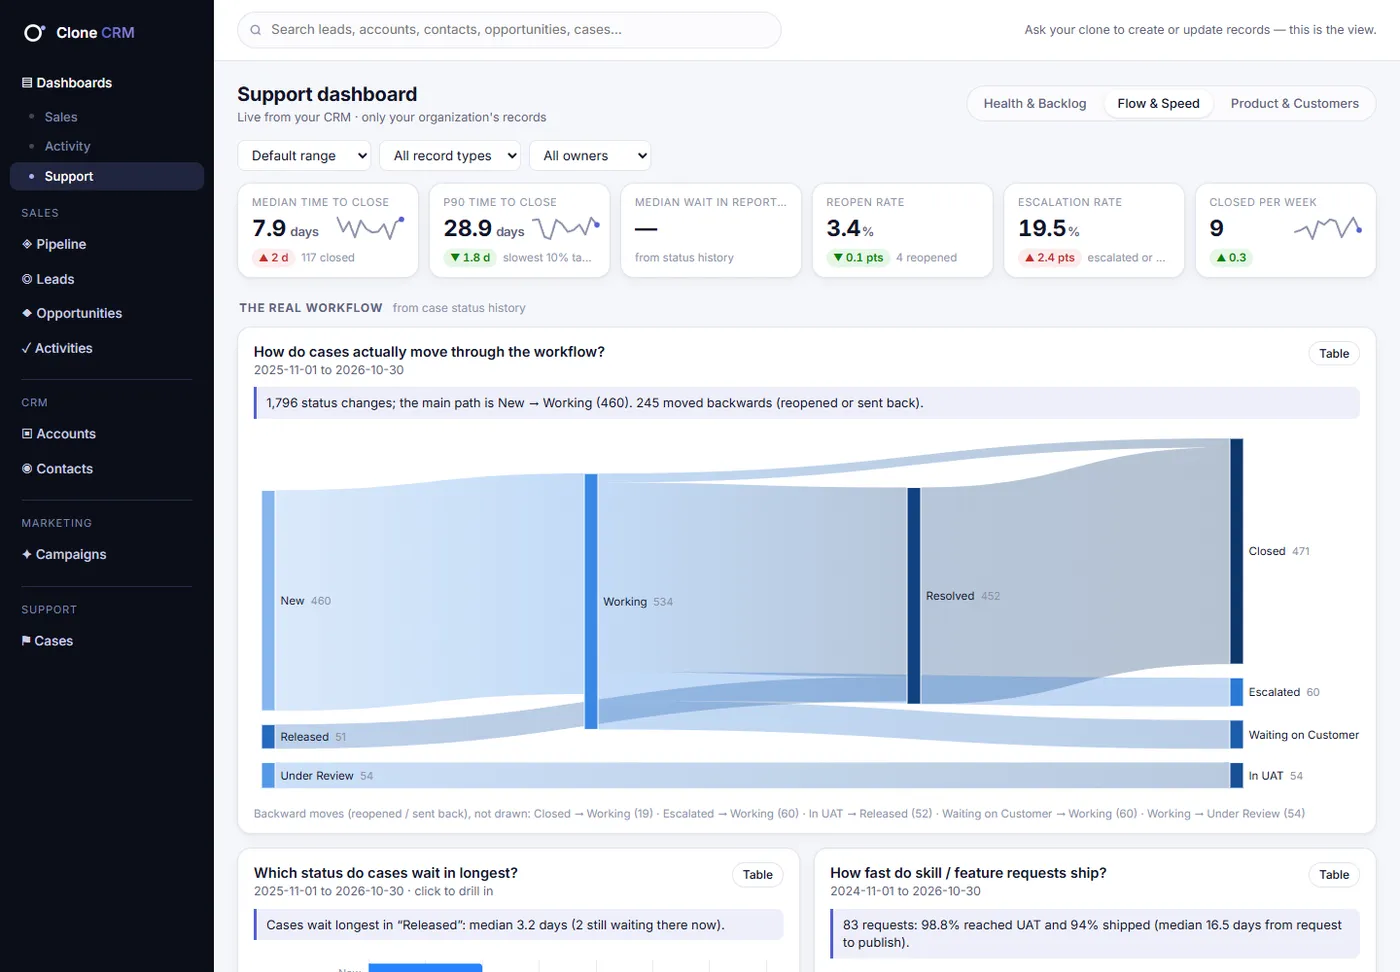
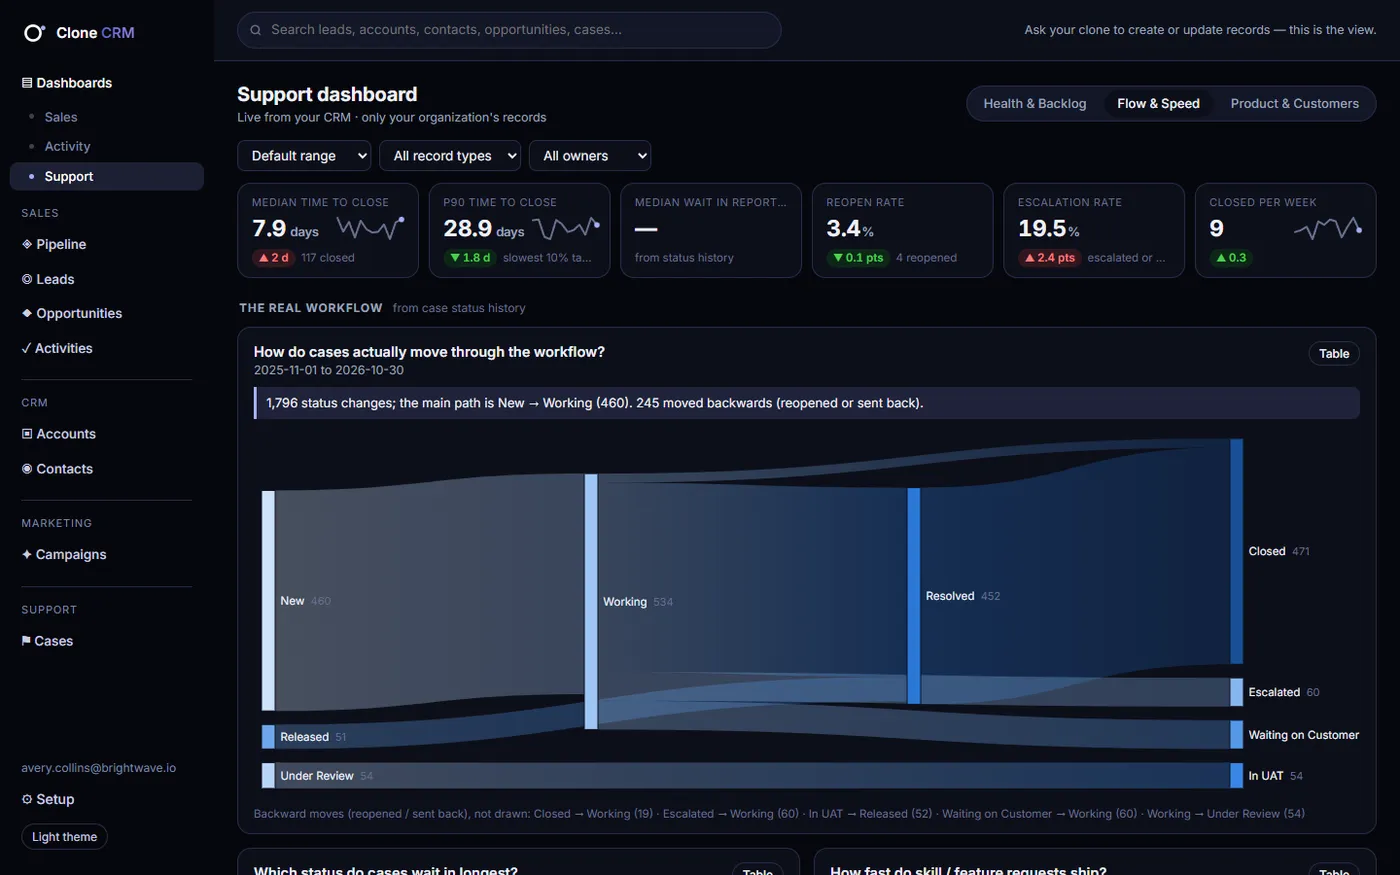
Where do cases wait?
- Your real workflow as a Sankey
- Time in each status
- Feature-request funnel
- Close-time spread
To-do list: Cases waiting longest
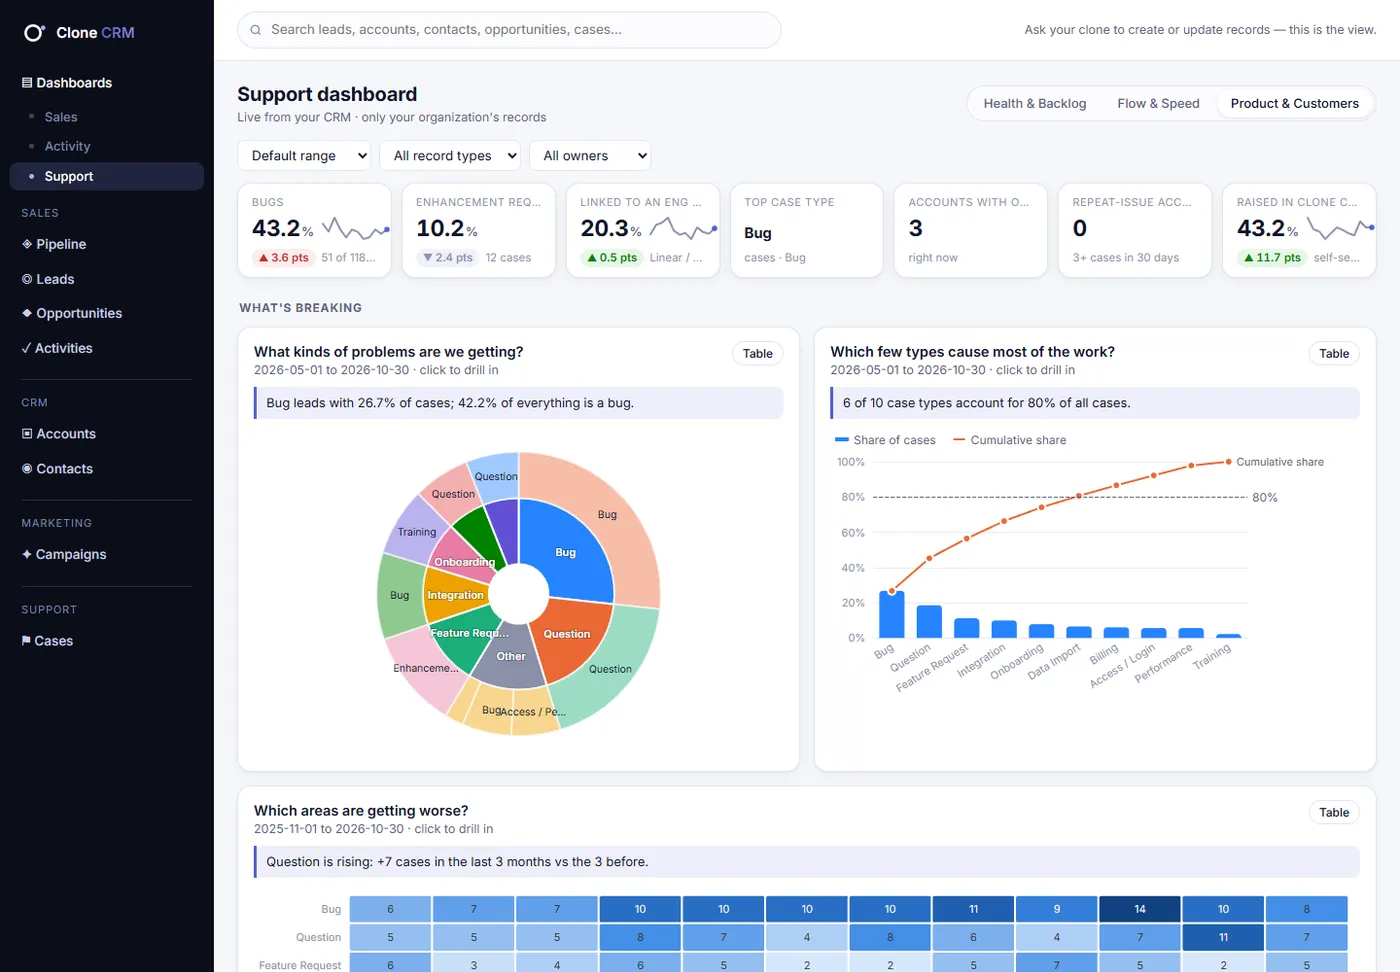
What is breaking, and for whom?
- Type → reason sunburst
- Areas getting worse
- Bug trend
- Channel mix, clone chat included
To-do list: Accounts at risk
Ask for a number. Get the chart.
What's our open pipeline by stage?
$1.43M open across 61 deals. Contract Negotiation holds the most (18 deals).
 Open the Pipeline & Forecast tab ↗
Which urgent or high cases are overdue?
2 urgent/high cases are past target; the oldest is 83 days. Most open work is Medium, 8–30 days old.
 Open Support · Health ↗
What renews next quarter?
31 contracts worth $72.7K a month renew November through January. November is the heaviest month.
 Open Revenue & Contracts ↗
Built for the way you look at it.
Filters on every dashboard: date range, record type and owner.
Screens and examples use a fictional demo company with generated data.
Dashboards: questions, answered.
Do I have to build any reports?
No. Nine dashboard tabs ship ready on day one, built on 83 reports. Every chart title is a question and comes with a one-line answer computed from your data.
Can I filter them?
Every dashboard filters by date range, record type and owner, and each chart has a table view and a click-through to the records behind it. Light and dark mode are both included.
Can I get a chart in chat?
Yes. Ask your Clone a metrics question and it answers with the numbers, a Clone-styled chart and a link to the matching dashboard tab.
Do the dashboards include my custom fields and record types?
Record type is a filter on every dashboard, and your custom fields and record types show up in the app and in your Clone's answers.
See your own numbers. On day one.
Book a demo and see the nine dashboards on a pipeline like yours.